News
Weekly Crypto Report: Hacks, Market Trends, and the Latest in Blockchain and Web3

Welcome to your go-to source for all things Web3, Blockchain and Crypto! Our Weekly report dives into the freshest updates and game-changing developments in the fast-paced world. We curate the best data from trusted sources to keep you ahead of the curve. Ready to stay informed and inspired? Let’s explore the latest trends and insights together!
1. Web3, Blockchain & Crypto Breaking News This Week
Here are this week’s major breaking news reports related to Web3, Blockchain, and crypto that you should never miss.
- Japanese Crypto Exchange DMM Bitcoin Hacked, Loses $305 Million
DMM Bitcoin Suffered a hack, losing 4,502.9 bitcoins worth $305 million. The exchange investigates and implements measures to prevent future attacks.
- Riot Platforms Seeks to Acquire Bitfarms Ltd.
Riot Platforms aims to acquire Bitfarms, owning 9.25% and planning a public takeover offer despite Bitfarms’ board rejection.
- Ramp Expands Crypto-to-Fiat Services Across Europe
Ramp now supports SEPA money transfers and over 35 local currencies, enabling seamless crypto cash-outs directly to credit and debit cards across Europe.
- ENS Labs Proposes Expansion to Layer-2 Protocols
ENS Labs suggests expanding Ethereum Name Service to layer-2 scaling, making ‘.eth’ names cheaper and more accessible, through no specific layer-2 network is chosen yet.
- Former FTX Co-CEO Ryan Salame Sentenced to Prison
Ryan Salame received a 90-month prison sentence for illegal political contributions and unlicensed money-transmitting business conspiracies.
- ASI Alliance Finalise Merger, Launches New Token
Fetch.ai, SingularityNET, and Ocean Protocol merge to form the Artificial Superintelligence Alliance, launching the ASI token, enhancing AI network scalability.
- Argentina and El Salvador Discuss Bitcoin Adoption
Argentinian and Salvadoran officials met to discuss enhancing Bitcoin adoption and leveraging EI Salvador’s experience with digital assets.
- Donald Trump Opposes Central Bank Digital Currency
Trump vows to block the creation of a central bank digital currency in the US if re-elected, making cryptocurrency a key election issue.
- Caitlyn Jenner Promotes $JENNER Meme Coin.
Caitlyn Jenner promotes $JENNER, a meme coin on the Solana-based DEX pump. fun, reaching a market cap of over $24 million despite community scepticism.
- Worldcoin Project Halted by Hong Kong Privacy Regulator
Hong Kong’s PCPD ordered Worldcoin to stop operations due to excessive biometric data collection, violating local privacy laws.
2. Blockchain Weekly Analysis
The blockchain weekly analysis primarily covers the blockchain dominance analysis and the blockchain 7-day change analysis. In order to bring more clarity, the Layer 1 chains and Layer 2 chains are analysed separately.
2.1. Blockchain Dominance Analysis
Ethereum, TRON, BNB Smart Chain, Solana, and Arbitrum One are the top five blockchains as per dominance and TVL.
| Blockchains | Dominance | TVL |
| Ethereum | 64.85% | $65,327,694,474 |
| TRON | 8.21% | $8,270,766,940 |
| BNB Smart Chain | 5.25% | $5,291,115,742 |
| Solana | 4.76% | $4,796,403,295 |
| Arbitrum One | 3.08% | $3,104,010,123 |
| Others | 13.85% |
Among the top five blockchains, Ethereum dominates with 64.85%. TRON and BNB Smart Chain follow with 8.21% and 5.25%, respectively. Solana and Arbitrum One mark 4.76% and 3.08% dominance, respectively.
2.1.1. Top Five Layer 1 Chains By Dominance
Ethereum, BNB Smart Chain, Solana, Bitcoin and Avalanche are the top five Layer 1 Blockchain by dominance and TVL.
| Layer 1 Blockchains | Dominance | TVL |
| Ethereum | 81.35% | $65,397,387,128 |
| BNB Smart Chain | 6.58% | $5,292,935,843 |
| Solana | 5.97% | $4,798,824,590 |
| Bitcoin | 1.42% | $1,142,834,728 |
| Avalanche | 1.14% | $914,650,933 |
| Others | 3.54% |
Among the top five-layer 1 chains, Ethereum dominates with 81.35%. BNB Smart Chain and Solana follow with 6.58% and 5.97%, respectively. Bitcoin records 1.42% dominance, and Avalanche reports 1.14% dominance.
2.1.2. Top Five Layer 2 Chains By Dominance
Arbitrum One, Blast, Base, Polygon POS, and Optimism are the top five Layer 2 Blockchains on the basis of dominance and Total Value Locked.
| Layer 2 Blockchains | Dominance | TVL |
| Arbitrum One | 28.51% | $3,107,741,567 |
| Blast | 20.68% | $2,254,576,560 |
| Base | 16.04% | $1,748,575,639 |
| Polygon POS | 8.71% | $949,220,251 |
| Optimism | 7.67% | $836,324,225 |
| Others | 18.93% |
Among the top five-layer 2 chains, Arbitrum One dominates with 28.51%. Blast and Base closely follow with 20.68% and 16.04%, respectively. Polygon POS shows a dominance of 8.71%, and Optimism registers a dominance of 7.67%.
2.2. Blockchain 7-Day Change Analysis
Let’s analyse the top five Layer 1 chains using the 7-day change index.
| Layer 1 Blockchains | 7-Day Change |
| Ethereum | +1.8% |
| BNB Smart Chain | -4.4% |
| Solana | +1.3% |
| Bitcoin | -2.2% |
| Avalanche | -8.5% |
Only two blockchains among the top five L1 chains show a positive seven-day change: Ethereum, which displays a seven-day change of +1.8%, and Solana, which displays a change of +1.3%. Conversely, Avalanche, BNB Smart Chain, and Bitcoin display a negative seven-day change. Avalanche shows the highest negative seven-day change (-8.5%). BNB Smart Chain and Bitcoin follow with -4.4% and -2.2%, respectively.
Let’s analyse the top five Layer 2 chains using the 7-day change index.
| Layer 2 Blockchains | 7-Day Change |
| Arbitrum One | +1.7% |
| Blast | +19.4% |
| Base | +2.6% |
| Polygon POS | -2.7% |
| Optimism | -3.3% |
Among the top five L2 chains, at least three blockchains display a positive 7-day change. Blast shows the highest positive 7-day change of +19.4%. Base and Arbitrum One follow with +2.6% and +1.7%, respectively. Optimism showcases the highest negative 7-day change of -3.3%. Polygon POS follows with -2.7% change.
3. Cryptocurrency Weekly Analysis
The Cryptocurrency Weekly analysis covers a wide range of analyses, from the general cryptocurrency market cap analysis and the top gainers and losers analysis to the Stablecoin, Memecoin, AI Coins and Metaverse Coins analyses.
3.1. Top Cryptocurrency Categories By Market Cap
Layer 1 (LI), Smart Contract Platform, Andreessen Horowitz Portfolio, Alameda Research Portfolio, and Alleged SEC Securities are the top five cryptocurrency categories by Market Cap. The Layer 1 (L1) category, with a $2,088,167,099,227 market cap, is the one with the highest market cap. The Smart Contract Platform category follows with a $770,415,441,846 market cap.
| Crypto Categories | Market Cap | 7-Day Change |
| Layer 1 (L1) | $2,088,167,099,227 | -1.0% |
| Smart Contract Platform | $770,415,441,846 | +0.4% |
| Andreessen Horowitz Portfolio | $623,160,252,002 | +1.0% |
| Alameda Research Portfolio | $569,768,419,193 | +1.4% |
| Alleged SEC Securities | $246,966,021,146 | -3.1% |
Among the top five crypto categories, at least three show a positive 7-day change, though mild in nature. Alameda Research Portfolio, Andreessen Horowitz Portfolio, and Smart Contract Platform report +1.4%, +1.0% and +0.4% change, respectively. The biggest negative 7-day change is recorded by Alleged SEC Securities (-3.1%). The Layer 1 (L1) category follows with -1.0%.
3.1.1. Trending Categories This Week
PolitiFi, Pantera Capital Portfolio, Alleged SEC Securities, DePIN, Smart Contract Platform, and DWF Labs Portfolio are the top six trending categories this week.
| Trending Categories | Market Cap |
| PolitiFi | $1,781,076,640 |
| Pantera Capital Portfolio | $89,238,479,901 |
| Alleged SEC Securities | $246,840,741,279 |
| DePIN | $30,253,587,021 |
| Smart Contract Platform | $770,357,776,148 |
| DWF Labs Portfolio | $59,183,686,433 |
Among the top six trending categories of the week, the Smart Contract Platform category has the highest market cap of $770,357,776,148. The Alleged SEC Securities category follows with a $246,840,741,279 market cap. Pantera Capital Portfolio and DWF Labs Portfolio display $89,238,479,901 and $59,183,686,433 market cap, respectively.
3.2. Top Cryptocurrencies By Market Cap
The top five cryptocurrencies by market cap are Bitcoin, Ethereum, Tether, BNB, and Solana. Bitcoin has the highest market cap of $1,333,856,983,170. Ethereum follows with a market cap of $454,960,182,691.
| Cryptocurrencies | Market Cap | 7-Day Change |
| Bitcoin | $1,333,856,983,170 | -1.5% |
| Ethereum | $454,960,182,691 | +0.4% |
| Tether | $112,102,885,363 | -0.1% |
| BNB | $91,680,517,280 | -1.2% |
| Solana | $76,795,835,981 | -1.6% |
Among the top five cryptos, only one shows a positive 7-day change; Ethereum reports a 7-day change of +0.4%. The highest negative change is recorded by Solana (-1.6%). Bitcoin and BNB follow with -1.5% and -1.2%, respectively. Tether, the most prominent stablecoin, displays a mild change of -0.1%.
3.2.1. Trending Coins This Week
MANTRA, Notcoin, Foxy, JasmyCoin, and Pepe are the most trending cryptocurrencies at the time of preparing this analysis.
| Trending Cryptocurrencies | Market Cap |
| MANTRA | $610,502,346 |
| Notcoin | $1,293,303,319 |
| Foxy | $71,323,734 |
| JasmyCoin | $1,770,142,107 |
| Pepe | $6,419,889,652 |
Among the top five trending cryptocurrencies of the week, Pepe, a popular Memecoin, has the highest market cap of $6,419,889,652. JasmyCoin and Notcoin follow with $1,770,142,107 and $1,293,303,319, respectively. MANTRA displays a market cap of $610,502,346. Foxy registers a short market cap of $71,323,734.
3.2.2. Top Gainers & Losers This Week
Beercoin, Super Trump, MINATIVERSE, LandWolf and Notcoin are the week’s top gainers as per the 7-day gain index.
| Top Gainers | 7-Day Gain |
| Beercoin | +745.6% |
| Super Trump | +307.0% |
| MINATIVERSE | +296.5% |
| LandWolf | +236.6% |
| Notcoin | +162.0% |
Beercoin marks the highest 7-day gain of +745.6%. Super Trump and MINATIVERSE follow with +307.0% and +296.5%, respectively. LandWolf reports a 7-day change of +236.6%, and Notcoin records a 7-day gain of +162.0%.
Harambe on Solana, Apu Apustaja, The Doge NFT, OpSec, and enqAI are the top losers of the week as per the 7-day loss index.
| Top Losers | 7-Day Loss |
| Harambe on Solana | -53.9% |
| Apu Apustaja | -44.8% |
| The Doge NFT | -43.1% |
| OpSec | -41.2% |
| enqAI | -40.1% |
Harambe on Solana marks the highest 7-day loss of -53.9%. Apu Apustaja and The Doge NFT follow with -44.8% and -43.1%, respectively. OpSec and enqAI display -41.2% and -40.1% 7-day loss, respectively.
3.3. Top Stablecoins Analysis
Tether, USDC, Dai, Ethena USDe, and First Digital USD are the top five stablecoins as per market cap.
| Stablecoins | Market Cap |
| Tether | $111,812,258,509 |
| USDC | $32,336,510,399 |
| Dai | $5,303,873,042 |
| Ethena USDe | $2,999,857,950 |
| First Digital USD | $2,902,433,891 |
Among the top stablecoins, Tether has the highest market cap of $111,812,258,509. USDC and Dai follow with $32,336,510,399 and $5,303,873,042 market cap, respectively. Ethena USDe and First Digital USD mark $2,999,857,950 and $2,902,433,891 market cap, respectively.
3.4. Top Memecoins 7-Day Change Analysis
Dogecoin, Shiba Inu, Pepe, dogwifhat, and FLOKI are the top five Memecoins as per market cap. Dogecoin has the highest market cap of $23,012,805,115. Shiba Inu and Pepe follow with $14,884,794,410 and $6,426,728,734 market cap, respectively.
| Memecoins | Market Cap | 7-Day Change |
| Dogecoin | $23,012,805,115 | -3.3% |
| Shiba Inu | $14,884,794,410 | +2.3% |
| Pepe | $6,426,728,734 | +1.7% |
| dogwifhat | $3,337,699,708 | +16.2% |
| FLOKI | $2,481,188,793 | +14.0% |
Among the top five Memecoins, only Dogecoin shows a negative 7-day change; it marks a change of -3.3%. Dogwifhat displays the highest 7-day change of +16.2%. FLOKI closely follows with +14.0%. Shiba Inu and Pepe showcase +2.3% and +1.7% change, respectively.
3.5. Top AI Coins 7-Day Change Analysis
NEAR Protocol, Internet Computer, Fetch.ai, Render, and The Graph are the top five AI Coins as per market cap. NEAR Protocol has the highest market cap of $7,789,058,588 . Internet Computer and Fetch.ai closely follow with $5,578,204,219 and $5,372,352,253 market cap, respectively.
| AI Coins | Market Cap | 7-Day Change |
| NEAR Protocol | $7,789,058,588 | -9.8% |
| Internet Computer | $5,578,204,219 | -2.8% |
| Fetch.ai | $5,372,352,253 | -9.1% |
| Render | $3,892,248,710 | -2.4% |
| The Graph | $2,839,397,653 | -8.0% |
All the top five AI coins show a negative 7-day change. The highest negative 7-day change is recorded by NEAR Protocol (-9.8%). Fetch.ai and The Graph follow with -9.1% and -8.0%, respectively. Internet Computer registers a -2.8% change, and Render records a -2.4% change.
3.6. Top Metaverse Coins 7-Day Change Analysis
Render, FLOKI, Axie Infinity, The Sandbox, and Decentraland are the top five Metaverse Coins on the basis of market cap. Render has the highest market cap of $3,886,518,932. FLOKI, Axie Infinity, and The Sandbox closely follow with $2,458,516,480, $1,081,176,676 and $979,500,947 market cap, respectively.
| Metaverse Coins | Market Cap | 7-Day Change |
| Render | $3,886,518,932 | -2.4% |
| FLOKI | $2,458,516,480 | +14.0% |
| Axie Infinity | $1,081,176,676 | -7.4% |
| The Sandbox | $979,500,947 | -5.5% |
| Decentraland | $829,832,623 | -3.0% |
Among the top five Metaverse coins, only one coin shows a positive 7-day change; FLOKI records a 7-day change of +14.0%. The largest negative 7-day change is reported by Axie Infinity (-7.4%). The Sandbox and Decentraland follow with -5.5% and -3.0%, respectively. Render reports a minimal 7-day change of -2.4%.
4. Crypto ETF Weekly Analysis
The crypto ETF weekly analysis covers Bitcoin Spot ETFs, Bitcoin Futures ETFs, and Ethereum Futures ETFs.
4.1. Bitcoin Spot ETF Price Change Analysis
GBTC, IBIT, FBTC, ARKB and BITB are the top five Bitcoin Spot ETFs based on Asset Under Management. GBTC marks the highest AUM of $24.33B. IBIT closely follows with an AUM of $17.24B.
| Bitcoin Spot ETFs | Price | Change | AUM |
| Grayscale (GBTC) | $60.09 | -1.56% | $24.33B |
| BlackRock (IBIT) | $38.55 | -1.56% | $17.24B |
| Fidelity (FBTC) | $59.16 | -1.65% | $9.90B |
| Ark/21 Shares (ARKB) | $67.55 | -1.75% | $2.85B |
| Bitwise (BITB) | $36.85 | -1.65% | $2.16B |
All the top five Bitcoin Spot ETFs mark a negative change. Ark/21 Shares’s ARKB records the highest negative change of -1.75%. Both Fidelity’ FBTC and Bitwise’s BITB follow with the same change value of -1.65%. Grayscale’s GBTC and BlackRock’s IBIT, both, report the same value of -1.56%.
4.2. Bitcoin Futures ETF Price Change Analysis
BITO, XBTF, BTF, BITS, and ARKA are the top five Bitcoin Futures ETFs as per Asset Under Management. BITO has the highest AUM of $598.78M. XBTF follows with $42.41M AUM.
| Bitcoin Futures ETFs | Price | Change | AUM |
| ProShares (BITO) | $27.28 | -2.12% | $598.78M |
| VanEck (XBTF) | $39.22 | +0.33% | $42.41M |
| Valkyrie (BTF) | $21.07 | -0.61% | $38.20M |
| Global X (BITS) | $66.37 | -2.45% | $26.10M |
| Ark/21 Shares (ARKA) | $65.26 | +2.00% | $8.01M |
Among the top five Bitcoin Futures ETFs, at least two mark a positive change; Ark/21 Share’s ARKA and VanEck’s XBTF register +2.00% and +0.33% change, respectively. The highest negative change is reported by Global X’s BITS (-2.45%). ProShares’s BITO closely follows with -2.12% change. Valkyrie’s BTF also showcases a minimal change of -0.61%.
4.3. Ethereum Futures ETF Price Change Analysis
BITW, BTF, EFUT, EETH, and AETH are the top five Ethereum Futures ETFs based on Asset Under Management. BITW has the highest AUM of $478.00M. BTF follows with $25.93M AUM.
| Ethereum Futures ETFs | Price | Change | AUM |
| Bitwise (BITW) | $37.05 | +0.10% | $478.00M |
| Valkyrie (BTF) | $21.07 | -0.61% | $25.93M |
| VanEck (EFUT) | $29.25 | +0.58% | $7.84M |
| ProShares (EETH) | $81.83 | +0.38% | $6.43M |
| Bitwise (AETH) | $49.50 | +0.15% | $585.75K |
Among the top five Ethereum Futures ETFs, only one displays a negative change; Valkyrie’s BTF shows a change of -0.61%. Others showcase a positive change, though minimal in nature. The highest positive change is marked by VanEck’ EFUT (+0.58%). ProShare’s EETH, Bitwise’s AETH and Bitwise’s BITW follow with +0.38%, +0.15% and +0.10%, respectively.
5. DeFi Protocols Weekly Analysis
Lido, EigenLayer, AAVE, Maker and JustLend are the top five DeFi protocols as per Total Value Locked. Lido marks the highest TVL of $36.002B. EigenLayer and AAVE follow with $19.109B and $13.008B, respectively.
| DeFi Protocols | TVL | 7-Day Change |
| Lido | $36.002B | +2.88% |
| EigenLayer | $19.109B | +3.09% |
| AAVE | $13.008B | +0.40% |
| Maker | $8.87B | -1.67% |
| JustLend | $6.502B | -2.23% |
Among the top five DeFi Protocols, at least three record a positive 7-day change. EigenLayer registers the highest positive change of +3.9%. Lido and AACE follow with +2.88% and +0.40%, respectively. Conversely, JustLend reports the highest negative change of -2.23%. Maker follows with -1.67% change.
6. Crypto Exchange Weekly Analysis
6.1. Top Crypto Centralised Exchanges
Binance, Coinbase Exchange, Bybit, WhiteBIT, and OKX are the top five crypto centralised exchanges on the basis of Monthly Visits.
| Crypto Centralised Exchanges | Monthly Visits | Trust Score |
| Binance | 75.3M | 9/10 |
| Coinbase Exchange | 46.3M | 10/10 |
| Bybit | 31M | 10/10 |
| WhiteBIT | 24.8M | 8/10 |
| OKX | 24.1M | 10/10 |
Among the top five crypto centralised exchanges by Monthly Visits, Binance has the highest number of monthly visits of 75.3M. Coinbase Exchange and Bybit closely follow with 46.3M and 31M monthly visits, respectively. WhiteBIT marks 24.8M monthly visits and OKX 24.1M.
Of these exchanges, at least three, Coinbase Exchange, Bybit, and OKX, report a 10/10 trust score. Binance shows 9/10 trust score and WhiteBIT 8/10.
6.2. Top Crypto Decentralised Exchanges
Uniswap V3 (Ethereum), Jupiter, Orca, Uniswap V3 (Arbitrum One), and Rydium are the top five crypto decentralised exchanges on the basis of Market Share by Volume.
| Crypto Decentralised Exchanges | % Market Share by Volume | 24-Hour Volume |
| Uniswap V3 (Ethereum) | 21.4% | $1,165,265,584 |
| Jupiter | 13.6% | $739,042,874 |
| Orca | 6.5% | $351,937,928 |
| Uniswap V3 (Arbitrum One) | 6.1% | $332,249,299 |
| Raydium | 5.3% | $287,529,813 |
Among the top five decentralised crypto exchanges, Uniswap V3 (Ethereum) has the highest marke share by volume in per cent of 21.4%. Jupiter follows with 13.6%. Orca, Uniswap V3 (Arbitrum One), and Raydium register 6.5%, 6.1% and 5.3%, respectively.
6.3. Top Crypto Derivative Exchanges
Binance (Futures), Bybit(Futures), Deepcoin (Derivatives), Bitget Futures, and CoinW (Futures) are the top five crypto derivative exchanges by 24-hour open interest.
| Crypto Derivative Exchanges | 24-Hour Open Interest | 24-Hour Volume |
| Binance (Futures) | $21,163,375,400 | $48,434,469,183 |
| Bybit (Futures) | $13,529,713,119 | $15,858,146,927 |
| Deepcoin (Derivatives) | $11,096,765,826 | $6,534,055,599 |
| Bitget Futures | $10,764,440,969 | $15,882,809,660 |
| CoinW (Futures) | $7,914,807,900 | $26,636,487,009 |
Among the top five crypto derivative exchanges, Binance (Futures) has the highest 24-hour Open Interest of $21,163,375,400. Bybit (Futures) and DeepCoin (Derivatives) follow with $13,529,713,119 and $11,096,765,826, respectively. Of these exchanges, Binance (Futures) marks the highest volume of $48,434,469,183. CoinW (Futures) follows with $26,636,487,009 volume.
7. NFT Marketplace Weekly Analysis
Blur, Blur Aggregator, Cryptopunks, Gem, X2Y2, and Gem are the top five NFT Marketplaces by Market Share. Blur has the highest market share of 68.79%. Blur Aggregator and Cryptopunks follow with 23.38% and 4.43% market share, respectively.
| NFT Marketplaces | Market Share | Volume Change (Change of last 7-D Volume over the Previous 7-D Volume) |
| Blur | 68.79% | -25.81% |
| Blur Aggregator | 23.38% | -32.53% |
| Cryptopunks | 4.43% | -9.93% |
| X2Y2 | 1.30% | +113% |
| Gem | 0.96% | -0.62% |
Among the top five NFT marketplaces, only one shows a positive volume change; X2Y2 records a massive change of +113%. The highest negative change is recorded by the Blur Aggregator (-32.53%). Blur closely follows with -25.81%. Cryptopunks display a change of -9.93%. Gem registers a minimal change of -0.62%.
7.1. Top NFT Collectibles This Week
Azuki #3374, $ORDI BRC-20 NFTs #8b1e444e, BOOGLE #Ai822dfBR7, CryptoPunks #9461, and CryptoPunks #1714 are the top NFT collectables based on Price.
| NFT Collectibles | Price |
| Azuki #3374 | $393,112.31 |
| $ORDI BRC-20 NFTs #8b1e444e | $305,258.05 |
| BOOGLE #Ai822dfBR7 | $206,935.53 |
| CryptoPunks #9461 | $160,409.63 |
| CryptoPunks #1714 | $160,409.63 |
Azuki #3374 marks the highest price of $393,112.31. $ORDI BRC-20 NFTs #8b1e444e and BOOGLE #Ai822dfBR7 follow with $305,258.05 and $206,935.53 price, respectively. CryptoPunks #9461 reports $160,409.63 price, and CryptoPunks #1714 registers $160,409.63 price.
8. Web3, Blockchain & Crypto Funding Analysis
8.1. Crypto Fundraising Trend
| Week | Funds Raised | Number of Fundraising Rounds |
| May 27 – June 2, 2024 | $348.10M | 38 |
| May 20 – 26, 2024 | $250.47M | 32 |
This week, the crypto sector has so far raised nearly $348.10M, higher than the previous year’s value of $250.47M.
8.2. Most Active Investors This Week
Animoca Brands, DWF Labs, Blockchain Founders Fund, SNZ Holdings, and The Spartan are the most active investors this week, based on the number of deals.
| Investors (or Fund’s Name) | Deals (26 May – 1 June, 2024) | Investments | Lead Investments |
| Animoca Brands | 7 | 6 | 1 |
| DWF Labs | 3 | 2 | 1 |
| Blockchain Founders Fund | 3 | 2 | 1 |
| SNZ Holdings | 3 | 2 | 1 |
| The Spartan Group | 3 | 3 | 0 |
Among the most active investors, Animoca Brands records the highest number of deals of 7, of which at least 6 are investments and one lead investment. DWF Labs, Blockchain Founders Fund, SNZ Holdings, and The Spartan Group mark three deals each; among them, The Spartan Group records no lead investments, but others register a deal each.
8.3. Crypto Fundraising By Category
Blockchain Infrastructure, Blockchain Services, CeFi, Chain, DeFi, GameFi, NFT and Social are the categories raised funds this week.
| Category | Number of Fundraising Rounds (May 27 – June 2, 24) | Funds Raised |
| Blockchain Infrastructure | 6 | $98.50M |
| Blockchain Services | 5 | $170.30M |
| CeFi | 2 | $7.25M |
| Chain | 3 | $8.30M |
| DeFi | 9 | $34.20M |
| GameFi | 8 | $23.80M |
| Social | 5 | $5.75M |
Blockchain Services is the category that raised the highest amount of $170.30M. Blockchain Infrastructure follows with $98.50M. DeFi and GameFi show $34.20M and $23.80M funds raised, respectively. Chain, CeFi and Social report $8.30M, $7.25M, and $5.75M, respectively.
8.4. Top Crypto Investment Locations
Apart from the undisclosed category, Singapore, the US, China, Switzerland, Cayman Islands, and Colombia are the top crypto investment locations, on the basis of funds raised.
| Investment Location | Funds Raised (May 26 – June 1, 2024) | Funds Raised % | Number of Rounds |
| Singapore | $150.00M | 43% | 2 |
| Undisclosed | $93.65M | 27% | 23 |
| United States | $86.45M | 25% | 6 |
| China | $6.00M | 2% | 1 |
| Switzerland | $5.00M | 1% | 1 |
| Cayman Island | $4.00M | 1% | 1 |
| Colombia | $3.00M | 1% | 1 |
Singapore is the topmost crypto investment location, with $150.00M funds raised. The Undisclosed category is the one which follows with $93.65M. The US, the third highest crypto investment location, records $86.45M funds raised. China, Switzerland, Cayman Island, and Colombia mark $6.00M, $5.00M, $4.0M and $3.00M, respectively.
8.5. Most Active Crypto VC Jurisdictions
The US, Singapore, China, the UK, Switzerland, and the UAE are the most active crypto venture capital jurisdictions.
| Crypto VC Jurisdiction | Number of Projects (May 26 – June 1, 2024) |
| The United States | 69 |
| Singapore | 20 |
| China | 17 |
| The United Kingdom | 6 |
| Switzerland | 5 |
| The UAE | 5 |
The US, with 69 projects, is the top most venture capital jurisdiction this week. Singapore and China follow with 20 and 17 projects, respectively. The UK shows six projects, and Switzerland and the UAE, both, record five projects each.
9. Web 3, Blockchain & Crypto Hack Updates
The total value hacked is $8.2B. The total value hacked in DeFi is $5.96B, and total value hacked in Bridges is $2.83 billion.
| Total Value Hacked | $8.2B
Total Value Hacked in DeFi$5.96BTotal Value Hacked in Bridges $2.83B |
| Project Name | Amount Lost | Date |
| DMM Bitcoin | $305M | 31 May, 2024 |
| Gala | $22M | 20 May, 2024 |
| ALEX | $23.9M | 16 May. 2024 |
| pump.fun | $2M | 16 May, 2024 |
| Sonne Finance | $20M | 15 May, 2024 |
DMM Bitcoin, Gala, ALEX, pump.fun and Sonne Finance are the top five project hacks reported this month. The Sonne Finance hack is the first reported this month. In this hack reported on 15th May, 2024, the project lost nearly $20M. ALEX and pump.fun were reported on 16th May. In the ALEX hack, nearly $23.9M was lost. In the pump.fun hack, only $2M was lost. It is the smallest hack this month in terms of the amount lost. In the Gala hack, reported on 20th May, nearly $22M were lost. The DMM Bitcoin hack, reported on 31st May, 2024, is the latest hack. The hack resulted in a huge loss of $305M, which is the worst loss reported in recent history.
Endnote
This report comprehensively analyses the current performance of various blockchains and cryptocurrencies, including Bitcoin, Altcoins, Stablecoins, AI Coins, Memecoins and Metaverse. It highlights trending coins, top gainers and losers, and delves into Crypto ETFs such as Bitcoin Spot ETFS, Bitcoin Futures ETFs, and Ethereum Futures ETFs. Additionally, it examines centralised, decentralised, and derivatives crypto exchanges, DeFi protocols, and NFT marketplaces. The report also covers crypto fundraising activities, prominent investors, key investment locations, and notable crypto hacks reported lately.
News
An enhanced consensus algorithm for blockchain
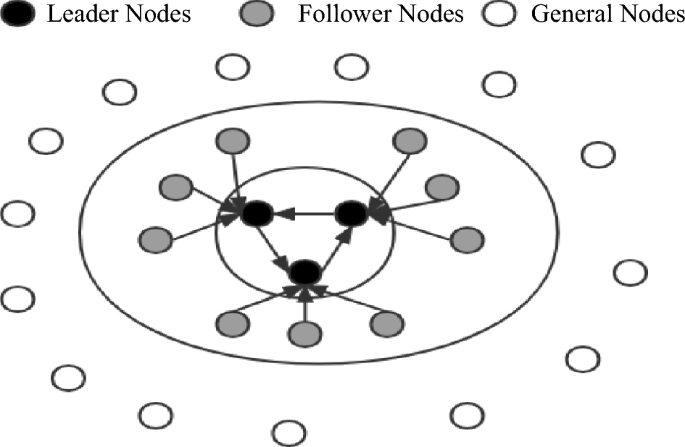
The introduction of the link and reputation evaluation concepts aims to improve the stability and security of the consensus mechanism, decrease the likelihood of malicious nodes joining the consensus, and increase the reliability of the selected consensus nodes.
The link model structure based on joint action
Through the LINK between nodes, all the LINK nodes engage in consistent activities during the operation of the consensus mechanism. The reputation evaluation mechanism evaluates the trustworthiness of nodes based on their historical activity status throughout the entire blockchain. The essence of LINK is to drive inactive nodes to participate in system activities through active nodes. During the stage of selecting leader nodes, nodes are selected through self-recommendation, and the reputation evaluation of candidate nodes and their LINK nodes must be qualified. The top 5 nodes of the total nodes are elected as leader nodes through voting, and the nodes in their LINK status are candidate nodes. In the event that the leader node goes down, the responsibility of the leader node is transferred to the nodes in its LINK through the view-change. The LINK connection algorithm used in this study is shown in Table 2, where LINKm is the linked group and LINKP is the percentage of linked nodes.
Table 2 LINK connection algorithm.
Node type
This paper presents a classification of nodes in a blockchain system based on their functionalities. The nodes are divided into three categories: leader nodes (LNs), follower nodes (FNs), and general nodes (Ns). The leader nodes (LNs) are responsible for producing blocks and are elected through voting by general nodes. The follower nodes (FNs) are nodes that are linked to leader nodes (LNs) through the LINK mechanism and are responsible for validating blocks. General nodes (N) have the ability to broadcast and disseminate information, participate in elections, and vote. The primary purpose of the LINK mechanism is to act in combination. When nodes are in the LINK, there is a distinction between the master and slave nodes, and there is a limit to the number of nodes in the LINK group (NP = {n1, nf1, nf2 ……,nfn}). As the largest proportion of nodes in the system, general nodes (N) have the right to vote and be elected. In contrast, leader nodes (LNs) and follower nodes (FNs) do not possess this right. This rule reduces the likelihood of a single node dominating the block. When the system needs to change its fundamental settings due to an increase in the number of nodes or transaction volume, a specific number of current leader nodes and candidate nodes need to vote for a reset. Subsequently, general nodes need to vote to confirm this. When both confirmations are successful, the new basic settings are used in the next cycle of the system process. This dual confirmation setting ensures the fairness of the blockchain to a considerable extent. It also ensures that the majority holds the ultimate decision-making power, thereby avoiding the phenomenon of a small number of nodes completely controlling the system.
After the completion of a governance cycle, the blockchain network will conduct a fresh election for the leader and follower nodes. As only general nodes possess the privilege to participate in the election process, the previous consortium of leader and follower nodes will lose their authorization. In the current cycle, they will solely retain broadcasting and receiving permissions for block information, while their corresponding incentives will also decrease. A diagram illustrating the node status can be found in Fig. 1.
Election method
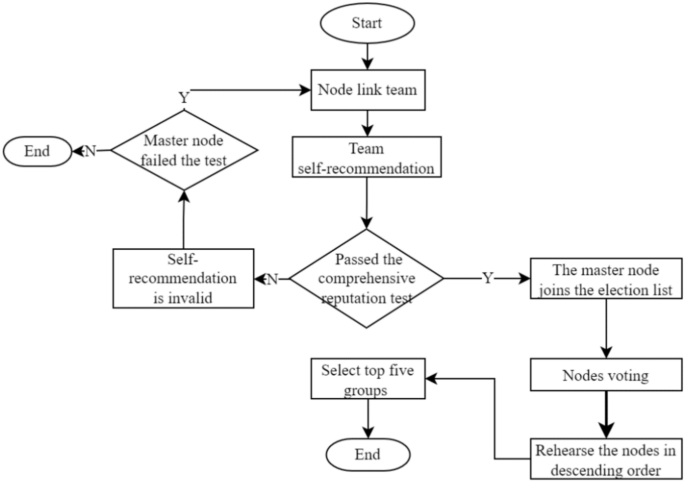
The election method adopts the node self-nomination mode. If a node wants to participate in an election, it must form a node group with one master and three slaves. One master node group and three slave node groups are inferred based on experience in this paper; these groups can balance efficiency and security and are suitable for other project collaborations. The successfully elected node joins the leader node set, and its slave nodes enter the follower node set. Considering the network situation, the maximum threshold for producing a block is set to 1 s. If the block fails to be successfully generated within the specified time, it is regarded as a disconnected state, and its reputation score is deducted. The node is skipped, and in severe cases, a view transformation is performed, switching from the master node to the slave node and inheriting its leader’s rights in the next round of block generation. Although the nodes that become leaders are high-reputation nodes, they still have the possibility of misconduct. If a node engages in misconduct, its activity will be immediately stopped, its comprehensive reputation score will be lowered, it will be disqualified from participating in the next election, and its equity will be reduced by 30%. The election process is shown in Fig. 2.
Incentives and penalties
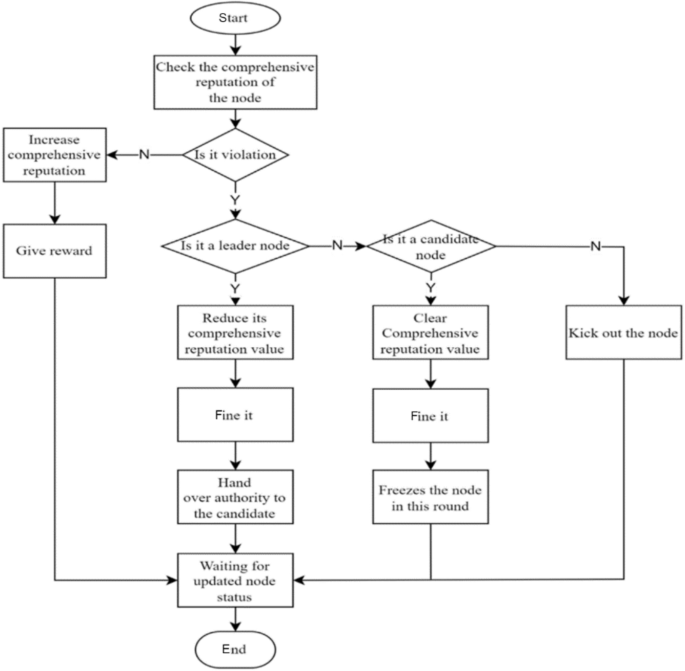
To balance the rewards between leader nodes and ordinary nodes and prevent a large income gap, two incentive/penalty methods will be employed. First, as the number of network nodes and transaction volume increase, more active nodes with significant stakes emerge. After a prolonged period of running the blockchain, there will inevitably be significant class distinctions, and ordinary nodes will not be able to win in the election without special circumstances. To address this issue, this paper proposes that rewards be reduced for nodes with stakes exceeding a certain threshold, with the reduction rate increasing linearly until it reaches zero. Second, in the event that a leader or follower node violates the consensus process, such as by producing a block out of order or being unresponsive for an extended period, penalties will be imposed. The violation handling process is illustrated in Fig. 3.
Violation handling process.
Comprehensive reputation evaluation and election mechanism based on historical transactions
This paper reveals that the core of the DPoS consensus mechanism is the election process. If a blockchain is to run stably for a long time, it is essential to consider a reasonable election method. This paper proposes a comprehensive reputation evaluation election mechanism based on historical records. The mechanism considers the performance indicators of nodes in three dimensions: production rate, tokens, and validity. Additionally, their historical records are considered, particularly whether or not the nodes have engaged in malicious behavior. For example, nodes that have ever been malicious will receive low scores during the election process unless their overall quality is exceptionally high and they have considerable support from other nodes. Only in this case can such a node be eligible for election or become a leader node. The comprehensive reputation score is the node’s self-evaluation score, and the committee size does not affect the computational complexity.
Moreover, the comprehensive reputation evaluation proposed in this paper not only is a threshold required for node election but also converts the evaluation into corresponding votes based on the number of voters. Therefore, the election is related not only to the benefits obtained by the node but also to its comprehensive evaluation and the number of voters. If two nodes receive the same vote, the node with a higher comprehensive reputation is given priority in the ranking. For example, in an election where node A and node B each receive 1000 votes, node A’s number of stake votes is 800, its comprehensive reputation score is 50, and only four nodes vote for it. Node B’s number of stake votes is 600, its comprehensive reputation score is 80, and it receives votes from five nodes. In this situation, if only one leader node position remains, B will be selected as the leader node. Displayed in descending order of priority as comprehensive credit rating, number of voters, and stake votes, this approach aims to solve the problem of node misconduct at its root by democratizing the process and subjecting leader nodes to constraints, thereby safeguarding the fundamental interests of the vast majority of nodes.
Comprehensive reputation evaluation
This paper argues that the election process of the DPoS consensus mechanism is too simplistic, as it considers only the number of election votes that a node receives. This approach fails to comprehensively reflect the node’s actual capabilities and does not consider the voters’ election preferences. As a result, nodes with a significant stake often win and become leader nodes. To address this issue, the comprehensive reputation evaluation score is normalized considering various attributes of the nodes. The scoring results are shown in Table 3.
Table 3 Comprehensive reputation evaluation.
Since some of the evaluation indicators in Table 3 are continuous while others are discrete, different normalization methods need to be employed to obtain corresponding scores for different indicators. The continuous indicators include the number of transactions/people, wealth balance, network latency, network jitter, and network bandwidth, while the discrete indicators include the number of violations, the number of successful elections, and the number of votes. The value range of the indicator “number of transactions/people” is (0,1), and the value range of the other indicators is (0, + ∞). The equation for calculating the “number of transactions/people” is set as shown in Eq. (1).
$$A_{1} = \left\{ {\begin{array}{*{20}l} {0,} \hfill & {{\text{G}} = 0} \hfill \\ {\frac{{\text{N}}}{{\text{G}}}*10,} \hfill & {{\text{G}} > 0} \hfill \\ \end{array} } \right.$$
(1)
where N represents the number of transactional nodes and G represents the number of transactions. It reflects the degree of connection between the node and other nodes. Generally, nodes that transact with many others are safer than those with a large number of transactions with only a few nodes. The limit value of each item, denoted by x, is determined based on the situation and falls within the specified range, as shown in Eq. (2). The wealth balance and network bandwidth indicators use the same function to set their respective values.
$${A}_{i}=20*\left(\frac{1}{1+{e}^{-{a}_{i}x}}-0.5\right)$$
(2)
where x indicates the value of this item and expresses the limit value.
In Eq. (3), x represents the limited value of this indicator. The lower the network latency and network jitter are, the higher the score will be.
The last indicators, which are the number of violations, the number of elections, and the number of votes, are discrete values and are assigned different scores according to their respective ranges. The scores corresponding to each count are shown in Table 4.
$$A_{3} = \left\{ {\begin{array}{*{20}l} {10*\cos \frac{\pi }{200}x,} \hfill & {0 \le x \le 100} \hfill \\ {0,} \hfill & {x > 100} \hfill \\ \end{array} } \right.$$
(3)
Table 4 Score conversion.
The reputation evaluation mechanism proposed in this paper comprehensively considers three aspects of nodes, wealth level, node performance, and stability, to calculate their scores. Moreover, the scores obtain the present data based on historical records. Each node is set as an M × N dimensional matrix, where M represents M times the reputation evaluation score and N represents N dimensions of reputation evaluation (M < = N), as shown in Eq. (4).
$${\text{N}} = \left( {\begin{array}{*{20}c} {a_{11} } & \cdots & {a_{1n} } \\ \vdots & \ddots & \vdots \\ {a_{m1} } & \cdots & {a_{mn} } \\ \end{array} } \right)$$
(4)
The comprehensive reputation rating is a combined concept related to three dimensions. The rating is set after rating each aspect of the node. The weight w and the matrix l are not fixed. They are also transformed into matrix states as the position of the node in the system changes. The result of the rating is set as the output using Eq. (5).
$$\text{T}=\text{lN}{w}^{T}=\left({l}_{1}\dots {\text{l}}_{\text{m}}\right)\left(\begin{array}{ccc}{a}_{11}& \cdots & {a}_{1n}\\ \vdots & \ddots & \vdots \\ {a}_{m1}& \cdots & {a}_{mn}\end{array}\right){\left({w}_{1}\dots {w}_{n}\right)}^{T}$$
(5)
Here, T represents the comprehensive reputation score, and l and w represent the correlation coefficient. Because l is a matrix of order 1*M, M is the number of times in historical records, and M < = N is set, the number of dimensions of l is uncertain. Set the term l above to add up to 1, which is l1 + l2 + …… + ln = 1; w is also a one-dimensional matrix whose dimension is N*1, and its purpose is to act as a weight; within a certain period of time, w is a fixed matrix, and w will not change until the system changes the basic settings.
Assume that a node conducts its first comprehensive reputation rating, with no previous transaction volume, violations, elections or vote. The initial wealth of the node is 10, the latency is 50 ms, the jitter is 100 ms, and the network bandwidth is 100 M. According to the equation, the node’s comprehensive reputation rating is 41.55. This score is relatively good at the beginning and gradually increases as the patient participates in system activities continuously.
Voting calculation method
To ensure the security and stability of the blockchain system, this paper combines the comprehensive reputation score with voting and randomly sorts the blocks, as shown in Eqs. (3–6).
$$Z=\sum_{i=1}^{n}{X}_{i}+nT$$
(6)
where Z represents the final election score, Xi represents the voting rights earned by the node, n is the number of nodes that vote for this node, and T is the comprehensive reputation score.
The voting process is divided into stake votes and reputation votes. The more reputation scores and voters there are, the more total votes that are obtained. In the early stages of blockchain operation, nodes have relatively few stakes, so the impact of reputation votes is greater than that of equity votes. This is aimed at selecting the most suitable node as the leader node in the early stage. As an operation progresses, the role of equity votes becomes increasingly important, and corresponding mechanisms need to be established to regulate it. The election vote algorithm used in this paper is shown in Table 5.
Table 5 Election vote counting algorithm.
This paper argues that the election process utilized by the original DPoS consensus mechanism is overly simplistic, as it relies solely on the vote count to select the node that will oversee the entire blockchain. This approach cannot ensure the security and stability of the voting process, and if a malicious node behaves improperly during an election, it can pose a significant threat to the stability and security of the system as well as the safety of other nodes’ assets. Therefore, this paper proposes a different approach to the election process of the DPoS consensus mechanism by increasing the complexity of the process. We set up a threshold and optimized the vote-counting process to enhance the security and stability of the election. The specific performance of the proposed method was verified through experiments.
The election cycle in this paper can be customized, but it requires the agreement of the blockchain committee and general nodes. The election cycle includes four steps: node self-recommendation, calculating the comprehensive reputation score, voting, and replacing the new leader. Election is conducted only among general nodes without affecting the production or verification processes of leader nodes or follower nodes. Nodes start voting for preferred nodes. If they have no preference, they can use the LINK mechanism to collaborate with other nodes and gain additional rewards.
View changes
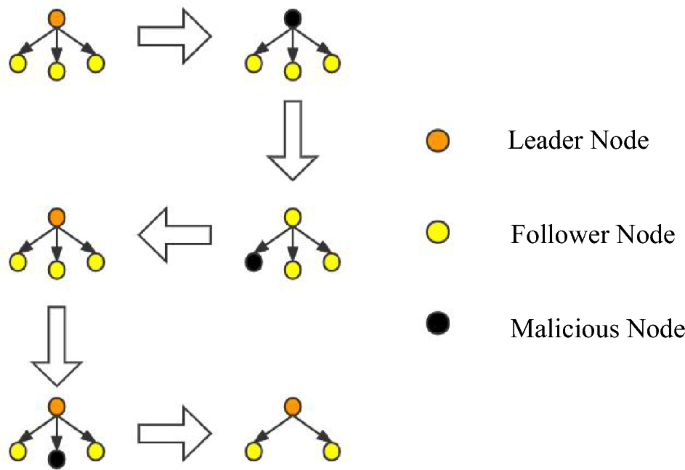
During the consensus process, conducting a large number of updates is not in line with the system’s interests, as the leader node (LN) and follower node (FN) on each node have already been established. Therefore, it is crucial to handle problematic nodes accurately when issues arise with either the LN or FN. For instance, when a node fails to perform its duties for an extended period or frequently fails to produce or verify blocks within the specified time range due to latency, the system will precisely handle them. For leader nodes, if they engage in malicious behavior such as producing blocks out of order, the behavior is recorded, and their identity as a leader node is downgraded to a follower node. The follower node inherits the leader node’s position, and the nature of their work is transformed as they swap their responsibilities of producing and verifying blocks with their original work. This type of behavior will not significantly affect the operation of the blockchain system. Instead of waiting until the end of the current committee round to punish malicious nodes, dynamic punishment is imposed on the nodes that affect the operation of the blockchain system to maintain system security. The view change operation is illustrated in Fig. 4.
In traditional PBFT, view changes are performed according to the view change protocol by changing the view number V to the next view number V + 1. During this process, nodes only receive view change messages and no other messages from other nodes. In this paper, the leader node group (LN) and follower node group (FN) are selected through an election of the LINK group. The node with LINKi[0] is added to the LN leader node group, while the other three LINK groups’ follower nodes join the FN follower node group since it is a configuration pattern of one master and three slaves. The view change in this paper requires only rearranging the node order within the LINK group to easily remove malicious nodes. Afterward, the change is broadcast to other committee nodes, and during the view transition, the LINK group does not receive block production or verification commands from the committee for stability reasons until the transition is completed.
News
The Hype Around Blockchain Mortgage Has Died Down, But This CEO Still Believes

LiquidFi Founder Ian Ferreira Sees Huge Potential in Blockchain Despite Hype around technology is dead.
“Blockchain technology has been a buzzword for a long time, and it shouldn’t be,” Ferriera said. “It should be a technology that lives in the background, but it makes everything much more efficient, much more transparent, and ultimately it saves costs for everyone. That’s the goal.”
Before founding his firm, Ferriera was a portfolio manager at a hedge fund, a job that ended up revealing “interesting intricacies” related to the mortgage industry.
Being a mortgage trader opened Ferriera’s eyes to a lot of the operational and infrastructure problems that needed to be solved in the mortgage-backed securities industry, he said. That later led to the birth of LiquidFi.
“The point of what we do is to get raw data attached to a resource [a loan] on a blockchain so that it’s provable. You reduce that trust problem because you have the data, you have the document associated with that data,” said the LiquidFi CEO.
Ferriera spoke with National Mortgage News about the value of blockchain technology, why blockchain hype has fizzled out, and why it shouldn’t.
News
New bill pushes Department of Veterans Affairs to examine how blockchain can improve its work

The Department of Veterans Affairs would have to evaluate how blockchain technology could be used to improve benefits and services offered to veterans, according to a legislative proposal introduced Tuesday.
The bill, sponsored by Rep. Nancy Mace, R-S.C., would direct the VA to “conduct a comprehensive study of the feasibility, potential benefits, and risks associated with using distributed ledger technology in various programs and services.”
Distributed ledger technology, including blockchain, is used to protect and track information by storing data across multiple computers and keeping a record of its use.
According to the text of the legislation, which Mace’s office shared exclusively with Nextgov/FCW ahead of its publication, blockchain “could significantly improve benefits allocation, insurance program management, and recordkeeping within the Department of Veterans Affairs.”
“We need to bring the federal government into the 21st century,” Mace said in a statement. “This bill will open the door to research on improving outdated systems that fail our veterans because we owe it to them to use every tool at our disposal to improve their lives.”
Within one year of the law taking effect, the Department of Veterans Affairs will be required to submit a report to the House and Senate Veterans Affairs committees detailing its findings, as well as the benefits and risks identified in using the technology.
The mandatory review is expected to include information on how the department’s use of blockchain could improve the way benefits decisions are administered, improve the management and security of veterans’ personal data, streamline the insurance claims process, and “increase transparency and accountability in service delivery.”
The Department of Veterans Affairs has been studying the potential benefits of using distributed ledger technology, with the department emission a request for information in November 2021 seeking input from contractors on how blockchain could be leveraged, in part, to streamline its supply chains and “secure data sharing between institutions.”
The VA’s National Institute of Artificial Intelligence has also valued the use of blockchain, with three of the use cases tested during the 2021 AI tech sprint focused on examining its capabilities.
Mace previously introduced a May bill that would direct Customs and Border Protection to create a public blockchain platform to store and share data collected at U.S. borders.
Lawmakers also proposed additional measures that would push the Department of Veterans Affairs to consider adopting other modernized technologies to improve veteran services.
Rep. David Valadao, R-Calif., introduced legislation in June that would have directed the department to report to lawmakers on how it plans to expand the use of “certain automation tools” to process veterans’ claims. The House of Representatives Subcommittee on Disability Assistance and Memorial Affairs gave a favorable hearing on the congressman’s bill during a Markup of July 23.
News
California DMV Uses Blockchain to Fight Auto Title Fraud

TDR’s Three Takeaways: California DMV Uses Blockchain to Fight Fraud
- California DMV uses blockchain technology to manage 42 million auto titles.
- The initiative aims to improve safety and reduce car title fraud.
- The immutable nature of blockchain ensures accurate and tamper-proof records.
The California Department of Motor Vehicles (DMV) is implementing blockchain technology to manage and secure 42 million auto titles. This innovative move aims to address and reduce the persistent problem of auto title fraud, a problem that costs consumers and the industry millions of dollars each year. By moving to a blockchain-based system, the DMV is taking advantage of the technology’s key feature: immutability.
Blockchain, a decentralized ledger technology, ensures that once a car title is registered, it cannot be altered or tampered with. This creates a highly secure and transparent system, significantly reducing the risk of fraudulent activity. Every transaction and update made to a car title is permanently recorded on the blockchain, providing a complete and immutable history of the vehicle’s ownership and status.
As first reported by Reuters, the DMV’s adoption of blockchain isn’t just about preventing fraud. It’s also aimed at streamlining the auto title process, making it more efficient and intuitive. Traditional auto title processing involves a lot of paperwork and manual verification, which can be time-consuming and prone to human error. Blockchain technology automates and digitizes this process, reducing the need for physical documents and minimizing the chances of errors.
Additionally, blockchain enables faster verification and transfer of car titles. For example, when a car is sold, the transfer of ownership can be done almost instantly on the blockchain, compared to days or even weeks in the conventional system. This speed and efficiency can benefit both the DMV and the vehicle owners.
The California DMV’s move is part of a broader trend of government agencies exploring blockchain technology to improve their services. By adopting this technology, the DMV is setting a precedent for other states and industries to follow, showcasing blockchain’s potential to improve safety and efficiency in public services.
-
 Ethereum10 months ago
Ethereum Posts First Consecutive Monthly Losses Since August 2023 on New ETFs
-

 Regulation10 months ago
Cryptocurrency Regulation in Slovenia 2024
-

 News10 months ago
New bill pushes Department of Veterans Affairs to examine how blockchain can improve its work
-

 Regulation10 months ago
Think You Own Your Crypto? New UK Law Would Ensure It – DL News
-

 Regulation10 months ago
A Blank Slate for Cryptocurrencies: Kamala Harris’ Regulatory Opportunity
-

 Regulation10 months ago
Upbit, Coinone, Bithumb Face New Fees Under South Korea’s Cryptocurrency Law
-
 Regulation10 months ago
Bahamas Passes Cryptocurrency Bill Designed to Prevent FTX, Terra Disasters
-

 Regulation10 months ago
India to Follow G20 Policy for Cryptocurrency Regulation: MoS Finance
-

 Ethereum1 year ago
Comment deux frères auraient dérobé 25 millions de dollars lors d’un braquage d’Ethereum de 12 secondes • The Register
-

 Videos1 year ago
Nexus Chain – Ethereum L2 with the GREATEST Potential?
-

 News10 months ago
EU supports 15 startups to fight online disinformation with blockchain
-

 Ethereum1 year ago
Scaling Ethereum with L2s damaged its Tokenomics. Is it possible to repair it?

